ImageryLayer
require(["esri/layers/ImageryLayer"], function(ImageryLayer) { /* code goes here */ });esri/layers/ImageryLayerRepresents an image service resource as a layer. An ImageryLayer retrieves and displays data from image services. An image service supports accessing the mosaicked image, its catalog, and the individual rasters in the catalog. An image service supports dynamic access and tiled access. Dynamic access provides more functionalities, and tiled access provides faster and more scalable access to precooked tiles.
If the image service is requested from a different domain, a CORS enabled server or a proxy is required.
Esri requires that when you use an ArcGIS Online basemap in your app, the map must include Esri attribution and you must be licensed to use the content. For detailed guidelines on working with attribution, please visit the official attribution in your app documentation. For information on terms of use, see the Terms of Use FAQ.
ImageryLayer rendering
ImageryLayer can be rendered on the server or on the client. This section talks about different approaches you can take when rendering an ImageryLayer in your application.
Applying renderingRule
Image service supports dynamic processing which can be applied through the layer’s renderingRule property. A rendering rule defines how the requested image should be rendered or processed. You can process images using raster functions published with the image service. You can also use well-known raster functions, such as the hillshade function for elevation data, the stretch function for multispectral data, and the colormap function for thematic data. When renderingRule is applied to the layer, the network request is made to the server for the image to be processed.
Applying renderer
ImageryLayer supports various renderers. By default, an ImageryLayer uses server side rendering. ImageryLayer parses a renderer specified by a user and leverages a renderingRule specified by the server or the user to achieve the expected rendering for the images. The server processes and renders the ImageryLayer and returns a ready-to-draw jpg or png image to the client.
When an ImageryLayer is created with lerc format, the client gets access to the raw data which can be used for client-side analysis and rendering. A default renderer that leverages available imagery information is applied to an ImageryLayer with lerc format if the pixelFilter function is not specified. The user can change this default renderer on the client-side by applying a renderer or pixelFilter. The pixelFilter is a good alternative if the existing renderers do not meet your requirements. If both renderer and pixelFilter are applied to the layer then the pixelFilter will take priority and its logic will be applied.
Applying pixelFilter
The pixelFilter can be used to colorize raw image pixels when ImageryLayer's format is set to lerc. It is a function that processes the pixelData. The pixelData object contains a pixelBlock property that gives you access to all of the pixels in the raster on the client. Inside the pixelFilter you may loop through all the pixels and process them. This function is a useful alternative if the existing renderers do not meet your requirements, because it gives you control over how to color image pixels. If both a renderer and pixelFilter are applied to the layer then the pixelFilter will take priority and its logic will be applied.
- See also:
Constructors
- new ImageryLayer(properties)
- Parameter:properties Objectoptional
See the properties for a list of all the properties that may be passed into the constructor.
Example:// Typical usage var layer = new ImageryLayer({ // URL to the imagery service url: "https://landsat2.arcgis.com/arcgis/rest/services/Landsat8_Views/ImageServer" });
Property Overview
| Name | Type | Summary | Class | |
|---|---|---|---|---|
| String | Blend modes are used to blend layers together to create an interesting effect in a layer, or even to produce what seems like a new layer. more details | more details | ImageryLayer | |
| Object | Describes the layer's supported capabilities. more details | more details | ImageryLayer | |
| Number | The compression quality value. more details | more details | ImageryLayer | |
| Number | Controls the tolerance of the lerc compression algorithm. more details | more details | ImageryLayer | |
| String | The copyright text as defined by the service. more details | more details | ImageryLayer | |
| String | The name of the class. more details | more details | Accessor | |
| String | The SQL where clause used to filter rasters. more details | more details | ImageryLayer | |
| Effect | Effect provides various filter functions that can be performed on the layer to achieve different visual effects similar to how image filters work. more details | more details | ImageryLayer | |
| Field[] | An array of fields in the layer. more details | more details | ImageryLayer | |
| String | The format of the exported image. more details | more details | ImageryLayer | |
| Extent | The full extent of the layer. more details | more details | Layer | |
| Boolean | Indicates if the layer has multidimensionalInfo. more details | more details | ImageryLayer | |
| String | The unique ID assigned to the layer. more details | more details | Layer | |
| Number | Indicates the maximum height of the image exported by the service. more details | more details | ImageryLayer | |
| Number | Indicates the maximum width of the image exported by the service. more details | more details | ImageryLayer | |
| String | Defines how to interpolate pixel values. more details | more details | ImageryLayer | |
| Boolean | Indicates whether the layer will be included in the legend. more details | more details | ImageryLayer | |
| String | Indicates how the layer should display in the LayerList widget. more details | more details | Layer | |
| Boolean | Indicates whether the layer's resources have loaded. more details | more details | Layer | |
| Error | The Error object returned if an error occurred while loading. more details | more details | Layer | |
| String | Represents the status of a load operation. more details | more details | Layer | |
| Object[] | A list of warnings which occurred while loading. more details | more details | Layer | |
| Number | The maximum scale (most zoomed in) at which the layer is visible in the view. more details | more details | ImageryLayer | |
| Number | The minimum scale (most zoomed out) at which the layer is visible in the view. more details | more details | ImageryLayer | |
| MosaicRule | Defines how overlapping images should be mosaicked. more details | more details | ImageryLayer | |
| Object | The multidimensional information associated with the layer if the layer's hasMultidimensions property is | more details | ImageryLayer | |
| Number|Number[] | The pixel value representing no available information. more details | more details | ImageryLayer | |
| String | Interpretation of the noData setting. more details | more details | ImageryLayer | |
| String | The name of an | more details | ImageryLayer | |
| Number | The opacity of the layer. more details | more details | Layer | |
| PixelFilterFunction | A function that processes pixelData. more details | more details | ImageryLayer | |
| String | Raster source pixel type. more details | more details | ImageryLayer | |
| Boolean | Indicates whether to display popups when features in the layer are clicked. more details | more details | ImageryLayer | |
| PopupTemplate | The popup template for the layer. more details | more details | ImageryLayer | |
| PortalItem | The portal item from which the layer is loaded. more details | more details | ImageryLayer | |
| String | Prefix used to define the fields from the raster attribute table. more details | more details | ImageryLayer | |
| Field[] | A complete list of fields that consists of raster catalog fields, item pixel value, service pixel value, service pixel value with various server defined function templates, and raster attribute table fields. more details | more details | ImageryLayer | |
| Number | Refresh interval of the layer in minutes. more details | more details | ImageryLayer | |
| ClassBreaksRenderer|UniqueValueRenderer|RasterStretchRenderer|RasterShadedReliefRenderer|RasterColormapRenderer | The renderer assigned to the layer. more details | more details | ImageryLayer | |
| RasterFunction | Specifies the rule for how the requested image should be rendered. more details | more details | ImageryLayer | |
| RasterInfo | Source raster information of the image service. more details | more details | ImageryLayer | |
| Object | The image service's metadata JSON exposed by the ArcGIS REST API. more details | more details | ImageryLayer | |
| SpatialReference | The spatial reference of the image service. more details | more details | ImageryLayer | |
| TimeExtent | The layer's time extent. more details | more details | ImageryLayer | |
| TimeInfo | TimeInfo provides information such as date fields that store start and end time for each feature and the fullTimeExtent for the layer. more details | more details | ImageryLayer | |
| TimeInterval | A temporary offset of the time data based on a certain TimeInterval. more details | more details | ImageryLayer | |
| String | The title of the layer used to identify it in places such as the Legend and LayerList widgets. more details | more details | Layer | |
| String | For ImageryLayer the type is always "imagery". more details | more details | ImageryLayer | |
| String | The URL to the REST endpoint of the layer. more details | more details | ImageryLayer | |
| Boolean | Determines if the layer will update its temporal data based on the view's timeExtent. more details | more details | ImageryLayer | |
| Number | The version of ArcGIS Server in which the image service is published. more details | more details | ImageryLayer | |
| Boolean | Indicates if the layer is visible in the View. more details | more details | Layer |
Property Details
- blendMode StringSince: ArcGIS API for JavaScript 4.16
Blend modes are used to blend layers together to create an interesting effect in a layer, or even to produce what seems like a new layer. Unlike the method of using transparency which can result in a washed-out top layer, blend modes can create a variety of very vibrant and intriguing results by blending a layer with the layer(s) below it.
When blending layers, a
top layeris a layer that has a blend mode applied. All layers underneath the top layer arebackground layers. The default blending mode isnormalwhere the top layer is simply displayed over the background layer. While this default behavior is perfectly acceptable, the use of blend modes on layers open up a world of endless possibilities to generate creative maps.The layers in a GroupLayer are blended together in isolation from the rest of the map.
In the following screenshots, the vintage shaded relief layer is displayed over a firefly world imagery layer. The
colorblend mode is applied to the vintage shaded relief and the result looks a new layer.
Known Limitations
- The blendMode is not supported in 3D SceneViews.
- The blendMode is not supported in printing and in legend.
The following factors will affect the blend result:
- Order of all layers
- Layer opacity
- Opacity of features in layers
- Visibility of layers
- By default, the very bottom layer in a map is drawn on a transparent background. You can change the MapView's background color.
Read more
Blend mode Description normal The top layer is displayed over the background layer. The data of the top layer block the data of background layer where they overlap. average Takes the mathematical average of top and background layers. Result of averageblend mode is often similar to the effect of setting the layer's opacity to 50%.Lighten blend modes:
The following blend modes create lighter results than all layers. In lighten blend modes, pure black colors in the top layer become transparent allowing the background layer to show through. White in the top layer will stay unchanged. Any color that is lighter than pure black is going to lighten colors in the top layer to varying degrees all way to pure white.
Lighten blend modes can be useful when lightening dark colors of the top layer or removing black colors from the result. The
plus,lightenandscreenmodes can be used to brighten layers that have faded or dark colors on a dark background.Blend mode Description lighten Compares top and background layers and retains the lighter color in the top layer. Colors in the top layer become transparent if they are darker than the overlapping colors in the background layer allowing the background layer to show through completely. Can be thought of as the opposite of darkenblend mode.lighter Colors in top and background layers are multiplied by their alphas (layer opacity and layer's data opacity. Then the resulting colors are added together. All overlapping midrange colors are lightened in the top layer. The opacity of layer and layer's data will affect the blend result. plus Colors in top and background layers are added together. All overlapping midrange colors are lightened in the top layer. This mode is also known as addorlinear-dodge.screen Inverts colors of the background layer and multiplies with colors of the top layer. The resulting colors will be lighter than the original color with less contrast. Screen can produce many different levels of brightening depending on the luminosity values of the top layer. Can be thought of as the opposite of the multiplymode.color-dodge Creates a brighter effect by decreasing the contrast between the top and background layers, resulting in saturated mid-tones and bright highlights. Darken blend modes:
The following blend modes create darker results than all layers. In darken blend modes, pure white in the top layer will become transparent allowing the background layer to show through. Black in the top layer will stay unchanged. Any color that is darker than pure white is going to darken a top layer to varying degrees all the way to pure black.
The
multiplyblend mode is often used to highlight shadows, show contrast, or accentuate an aspect of a map. For example, you can usemultiplyblend mode on a topographic map displayed over hillshade when you want to have your elevation show through the topographic layer. See the intro to layer blending sample.The
multiplyanddarkenmodes can be used to have dark labels of the basemap to show through top layers. See the darken blending sample.The
color-burnmode works well with colorful top and background layers since it increases saturation in mid-tones. It increases the contrast by tinting pixels in overlapping areas in top and bottom layers more towards the top layer color. Use this blend mode, when you want an effect with more contrast thanmultiplyordarken.The following screenshots show how the
multiplyblend mode used for creating a physical map of the world that shows both boundaries and elevation.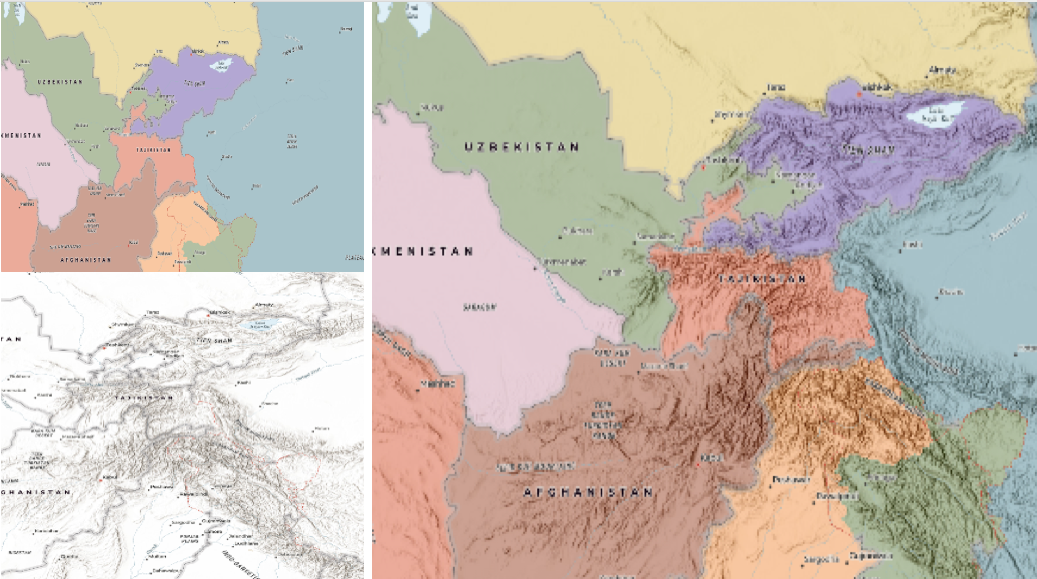
Blend mode Description darken Emphasizes the darkest parts of overlapping layers. Colors in the top layer become transparent if they are lighter than the overlapping colors in the background layer, allowing the background layer to show through completely. multiply Emphasizes the darkest parts of overlapping layers by multiplying colors of the top layer and the background layer. Midrange colors from top and background layers are mixed together more evenly. color-burn Intensifies the dark areas in all layers. It increases the contrast between top and background layers, by tinting colors in overlapping area towards the top color. To do this it inverts colors of the background layer, divides the result by colors of the top layer, then inverts the results. Contrast blend modes:
The following blend modes create contrast by both lightening the lighter areas and darkening the darker areas in the top layer by using lightening or darkening blend modes to create the blend. The contrast blend modes will lighten the colors lighter than 50% gray ([128,128,128]), and darken the colors darker than 50% gray. 50% gray will be transparent in the top layer. Each mode can create a variety of results depending on the colors of top and background layers being blended together. The
overlayblend mode makes its calculations based on the brightness of the colors in the background layer while all of the other contrast blend modes make their calculations based on the brightness of the top layer. Some of these modes are designed to simulate the effect of shining a light through the top layer, effectively projecting upon the layers beneath it.Contrast blend modes can be used to increase the contrast and saturation to have more vibrant colors and give a punch to your layers. For example, you can duplicate a layer and set
overlayblend mode on the top layer to increase the contrast and tones of your layer. You can also add a polygon layer with a white fill symbol over a dark imagery layer and applysoft-lightblend mode to increase the brightness in the imagery layer.The following screenshots show an effect of the
overlayblend mode on a GraphicsLayer. The left image shows when the buffer graphics layer has thenormalblend mode. As you can see, the gray color for the buffer polygon is blocking the intersecting census tracts. The right image shows when theoverlayblend mode is applied to the buffer graphics layer. Theoverlayblend mode darkens or lightens the gray buffer polygon depending on the colors of the background layer while the census tracts layer is shining through. See this in action.Normal blend mode Overlay blend mode 
Blend mode Description overlay Uses a combination of multiplyandscreenmodes to darken and lighten colors in the top layer with the background layer always shining through. The result is darker color values in the background layer intensify the top layer, while lighter colors in the background layer wash out overlapping areas in the top layer.soft-light Applies a half strength screenmode to lighter areas and and half strengthmultiplymode to darken areas of the top layer. You can think of thesoft-lightas a softer version of theoverlaymode.hard-light Multiplies or screens the colors, depending on colors of the top layer. The effect is similar to shining a harsh spotlight on the top layer. vivid-light Uses a combination of color-burnorcolor-dodgeby increasing or decreasing the contrast, depending on colors in the top layer.Component blend modes:
The following blend modes use primary color components, which are hue, saturation and luminosity to blend top and background layers. You can add a feature layer with a simple renderer over any layer and set
hue,saturation,colororluminosityblend mode on this layer. With this technique, you create a brand new looking map.The following screenshots show where the topo layer is blended with world hillshade layer with
luminosityblend mode. The result is a drastically different looking map which preserves the brightness of the topo layer while adapting the hue and saturation of the hillshade layer.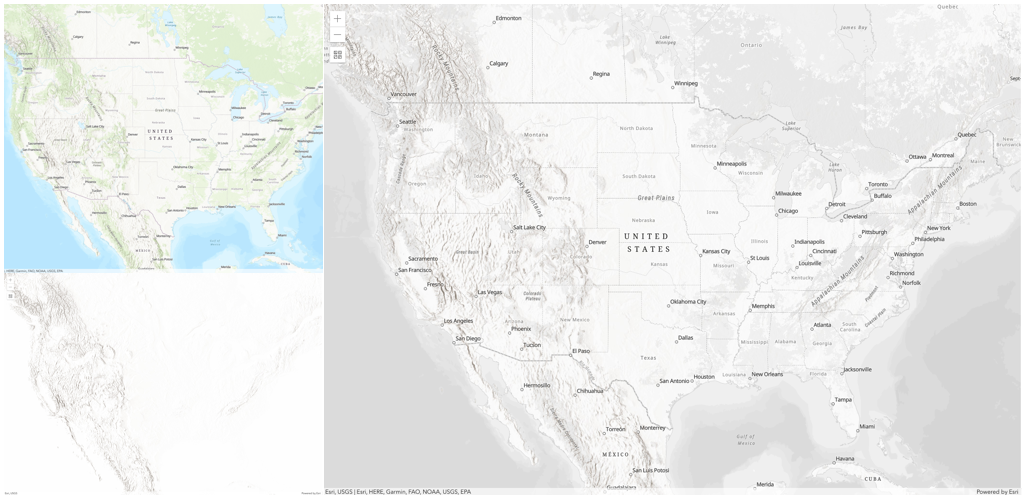
Blend mode Description hue Creates an effect with the hue of the top layer and the luminosity and saturation of the background layer. saturation Creates an effect with the saturation of the top layer and the hue and luminosity of the background layer. 50% gray with no saturation in the background layer will not produce any change. luminosity Creates effect with the luminosity of the top layer and the hue and saturation of the background layer. Can be thought of as the opposite of colorblend mode.color Creates an effect with the hue and saturation of the top layer and the luminosity of the background layer. Can be thought of as the opposite of luminosityblend mode.Composite blend modes:
The following blend modes can be used to mask the contents of top, background or both layers.
Destinationmodes are used to mask the data of the top layer with the data of the background layer.Sourcemodes are used to mask the data of the background layer with the data of the top layer.
The
destination-inblend mode can be used to show areas of focus such as earthquakes, animal migration, or point-source pollution by revealing the underlying map, providing a bird’s eye view of the phenomenon. Check out multiple blending and groupLayer blending samples to see composite blend modes in action.The following screenshots show feature and imagery layers on the left side on their own in the order they are drawn in the view. The imagery layer that contains land cover classification rasters. The feature layer contains 2007 county crops data. The right image shows the result of layer blending where
destination-inblendMode is set on the imagery layer. As you can see, the effect is very different from the original layers. The blended result shows areas of cultivated crops only (where both imagery and feature layers overlap).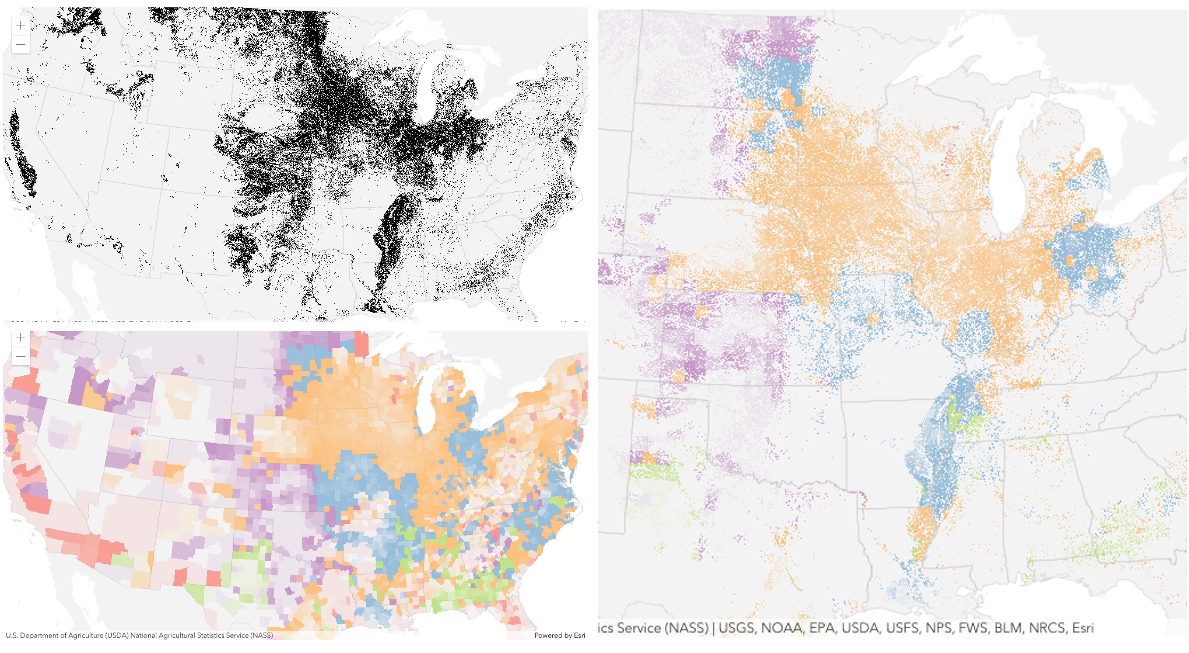
Blend mode Description destination-over Destination/background layer covers the top layer. The top layer is drawn underneath the destination layer. You'll see the top layer peek through wherever the background layer is transparent or has no data. destination-atop Destination/background layer is drawn only where it overlaps the top layer. The top layer is drawn underneath the background layer. You'll see the top layer peek through wherever the background layer is transparent or has no data. destination-in Destination/background layer is drawn only where it overlaps with the top layer. Everything else is made transparent. destination-out Destination/background layer is drawn where it doesn't overlap the top layer. Everything else is made transparent. source-atop Source/top layer is drawn only where it overlaps the background layer. You will see the background layer peek through where the source layer is transparent or has no data. source-in Source/top layer is drawn only where it overlaps with the background layer. Everything else is made transparent. source-out Source/top layer is drawn where it doesn't overlap the background layer. Everything else is made transparent. xor Top and background layers are made transparent where they overlap. Both layers are drawn normal everywhere else. Invert blend modes:
The following blend modes either invert or cancel out colors depending on colors of the background layer. These blend modes look for variations between top and background layers. For example, you can use
differenceorexclusionblend modes on two imagery layers of forest covers to visualize how forest covers changed from one year to another.The
invertblend mode can be used to turn any light basemap into a dark basemap to accommodate those who work in low-light conditions. The following screenshots show how setting theinvertblend mode set on a feature layer with a simple renderer turns the world terrain basemap into a dark themed basemap in no time.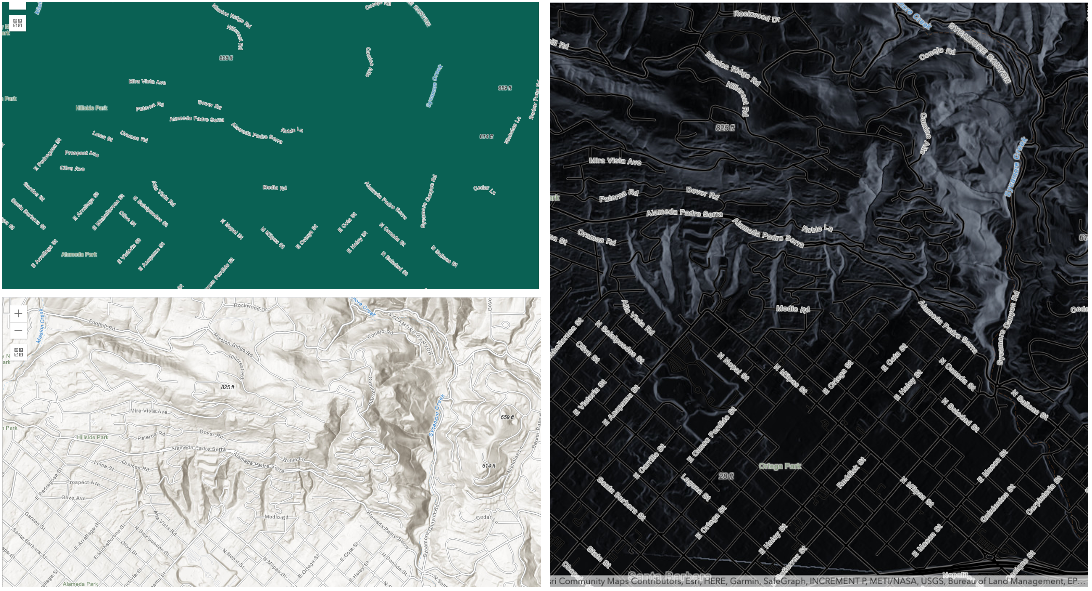
Blend mode Description difference Subtracts the darker of the overlapping colors from the lighter color. When two pixels with the same value are subtracted, the result is black. Blending with black produces no change. Blending with white inverts the colors. This blending mode is useful for aligning layers with similar content. exclusion Similar to the differenceblend mode, except that the resulting image is lighter overall. Overlapping areas with lighter color values are lightened, while darker overlapping color values become transparent.minus Subtracts colors of the top layer from colors of the background layer making the blend result darker. In the case of negative values, black is displayed. invert Inverts the background colors wherever the top and background layers overlap. The invert blend mode inverts the layer similar to a photographic negative. reflect This blend mode creates effects as if you added shiny objects or areas of light in the layer. Black pixels in the background layer are ignored as if they were transparent. Possible Values:"average"|"color-burn"|"color-dodge"|"color"|"darken"|"destination-atop"|"destination-in"|"destination-out"|"destination-over"|"difference"|"exclusion"|"hard-light"|"hue"|"invert"|"lighten"|"lighter"|"luminosity"|"minus"|"multiply"|"normal"|"overlay"|"plus"|"reflect"|"saturation"|"screen"|"soft-light"|"source-atop"|"source-in"|"source-out"|"vivid-light"|"xor"
- Default Value:normal
- See also:
- capabilities ObjectSince: ArcGIS API for JavaScript 4.16
Describes the layer's supported capabilities.
- Properties:
- operations Object
Describes operations supported by the layer.
- Specification:
- supportsComputeHistograms
Indicates if the layer supports a compute histograms operation from an area of interest.
supportsExportImageIndicates if the layer supports an export image operation based on a bounding box.
supportsIdentifyIndicates if the layer supports an identify operation on pixel values.
supportsMeasureIndicates if the layer supports mensuration.
supportsDownloadIndicates if the layer allows the source image to be downloaded.
supportsQueryIndicates if the layer supports an operation to query images.
supportsGetSamplesIndicates if the layer supports a sampling operation.
supportsProjectIndicates if the layer supports projection of geometries, including from/to image spatial reference.
supportsComputeStatisticsHistogramsIndicates if the layer supports an operation computing statistics and histograms from an area of interest.
supportsQueryBoundaryIndicates if the layer supports an operation to query the service's boundary.
supportsCalculateVolumeIndicates if the elevation layer supports an operation to compute volumes.
supportsComputePixelLocationIndicates if the layer supports computing pixel location in pixel space.
query ObjectDescribes query operations supported by the layer. Use the QueryTask to query an imagery layer.
- Specification:
- supportsStatistics
Indicates if the layer supports field-based statistical functions.
supportsOrderByIndicates if the layer returned in the query response can be ordered by one or more fields.
supportsDistinctIndicates if the layer supports queries for distinct values based on fields.
supportsPaginationIndicates if the layer supports paged queries.
supportsStandardizedQueriesOnlyIndicates if the layer supports use of standardized queries.
maxRecordCountThe maximum number of records that will be returned for a given query.
- compressionQuality Number
The compression quality value. Controls how much loss the image will be subjected to by the compression algorithm. Valid value ranges of compression quality are from 0 to 100. Only valid when using
jpgorjpgpngimage format.
- compressionTolerance Number
Controls the tolerance of the lerc compression algorithm. The tolerance defines the maximum possible error of pixel values in the compressed image. It's a double value.
- Default Value:0.01
- copyright String
The copyright text as defined by the service.
- Since: ArcGIS API for JavaScript 4.7
The name of the class. The declared class name is formatted as
esri.folder.className.
- definitionExpression String
The SQL where clause used to filter rasters. Only the rasters that satisfy the definition expression are displayed in the View. This property overrides the mosaicRule's where property if both properties are set on the layer.
- effect EffectSince: ArcGIS API for JavaScript 4.18
Effect provides various filter functions that can be performed on the layer to achieve different visual effects similar to how image filters work. This powerful capability allows you to apply css filter-like functions to layers to create custom visual effects to enhance the cartographic quality of your maps. This is done by applying the desired effect to the layer's
effectproperty as a string or an array of objects to set scale dependent effects.Known Limitations
- The effect is not supported in 3D SceneViews.
- The effect is not supported in printing and in legend.
- Default Value:null
- See also:
Examples:// the following effect will be applied to the layer at all scales // brightness will be applied first, then hue-rotate followed by contrast // changing order of the effects will change the final result layer.effect = "brightness(5) hue-rotate(270deg) contrast(200%)";// set a scale dependent bloom effect on the layer layer.effect = [ { scale: 36978595, value: "drop-shadow(3px, 3px, 4px)" }, { scale: 18489297, value: "drop-shadow(2px, 2px, 3px)" }, { scale: 4622324, value: "drop-shadow(1px, 1px, 2px)" } ];
An array of fields in the layer. Each field represents an attribute that may contain a value for each raster in the layer.
- See also:
- format String
The format of the exported image.
Possible Values:"png"|"png8"|"png24"|"png32"|"jpg"|"bmp"|"gif"|"jpgpng"|"lerc"|"tiff"
The full extent of the layer. By default, this is worldwide. This property may be used to set the extent of the view to match a layer's extent so that its features appear to fill the view. See the sample snippet below.
Example:// Once the layer loads, set the view's extent to the layer's fullextent layer.when(function(){ view.extent = layer.fullExtent; });
- hasMultidimensions Boolean
Indicates if the layer has multidimensionalInfo.
The unique ID assigned to the layer. If not set by the developer, it is automatically generated when the layer is loaded.
- imageMaxHeight NumberSince: ArcGIS API for JavaScript 4.4
Indicates the maximum height of the image exported by the service.
- Default Value:4100
- imageMaxWidth NumberSince: ArcGIS API for JavaScript 4.4
Indicates the maximum width of the image exported by the service.
- Default Value:15000
- interpolation StringSince: ArcGIS API for JavaScript 4.12
Defines how to interpolate pixel values.
Possible Values:"nearest"|"bilinear"|"cubic"|"majority"
- legendEnabled BooleanSince: ArcGIS API for JavaScript 4.12
Indicates whether the layer will be included in the legend.
- Default Value:true
Indicates how the layer should display in the LayerList widget. The possible values are listed below.
Value Description show The layer is visible in the table of contents. hide The layer is hidden in the table of contents. hide-children If the layer is a GroupLayer, BuildingSceneLayer, KMLLayer, MapImageLayer, TileLayer or WMSLayer, hide the children layers from the table of contents. Possible Values:"show"|"hide"|"hide-children"
- Default Value:show
Indicates whether the layer's resources have loaded. When
true, all the properties of the object can be accessed.- Default Value:false
The Error object returned if an error occurred while loading.
- Default Value:null
Represents the status of a load operation.
Value Description not-loaded The object's resources have not loaded. loading The object's resources are currently loading. loaded The object's resources have loaded without errors. failed The object's resources failed to load. See loadError for more details. Possible Values:"not-loaded"|"loading"|"failed"|"loaded"
- Default Value:not-loaded
A list of warnings which occurred while loading.
- maxScale Number
The maximum scale (most zoomed in) at which the layer is visible in the view. If the map is zoomed in beyond this scale, the layer will not be visible. A value of
0means the layer does not have a maximum scale. The maxScale value should always be smaller than the minScale value, and greater than or equal to the service specification.- Default Value:0
Examples:// The layer will not be visible when the view is zoomed in beyond a scale of 1:1,000 layer.maxScale = 1000;// The layer's visibility is not restricted to a maximum scale. layer.maxScale = 0;
- minScale Number
The minimum scale (most zoomed out) at which the layer is visible in the view. If the map is zoomed out beyond this scale, the layer will not be visible. A value of
0means the layer does not have a minimum scale. The minScale value should always be larger than the maxScale value, and lesser than or equal to the service specification.- Default Value:0
Examples:// The layer will not be visible when the view is zoomed out beyond a scale of 1:3,000,000 layer.minScale = 3000000;// The layer's visibility is not restricted to a minimum scale. layer.minScale = 0;
- mosaicRule MosaicRuleautocast
Defines how overlapping images should be mosaicked.
- multidimensionalInfo Object
The multidimensional information associated with the layer if the layer's hasMultidimensions property is
true. If defined, multidimensional information contains various dimensions of data for a particular value, such as time, depth, altitude, etc. Defining slices of particular dimensions in the layer is handled with the multidimensionalDefinition property of the mosaicRule.- Default Value:null
- Since: ArcGIS API for JavaScript 4.12
The pixel value representing no available information. Can be a number (same value for all bands) or array (specific value for each band).
- noDataInterpretation StringSince: ArcGIS API for JavaScript 4.12
Interpretation of the noData setting.
Value Description any Pixel is transparent if any band matches noDatavalue.all Pixel is transparent only if all bands match noDatavalue.Possible Values:"any"|"all"
- objectIdField String
The name of an
oidfield containing a unique value or identifier for each raster in the layer.- See also:
The opacity of the layer. This value can range between
1and0, where0is 100 percent transparent and1is completely opaque.- Default Value:1
Example:// Makes the layer 50% transparent layer.opacity = 0.5;
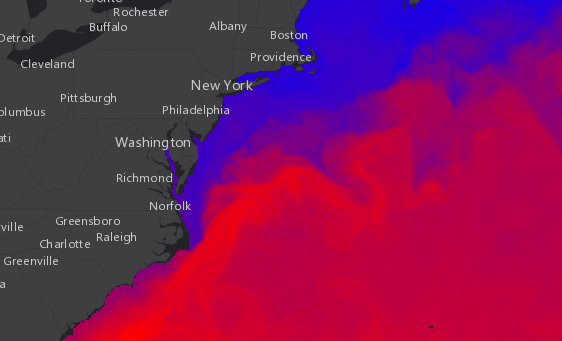
- pixelFilter PixelFilterFunction
A function that processes pixelData. The
pixelDataobject contains a pixelBlock property that gives you access to all of the pixels in the raster on the client.Inside the
pixelFilteryou may loop through all the pixels found in thepixelBlockproperty of thepixelDataobject and process them. This function may be used to hide some pixels from the view, alter their values, and change their color. The pixelFilter should be used when the imagery layer's format islercortiffas these formats return raw pixel data to the client.- See also:
Example:var layer = new ImageryLayer({ url: // url to the image service pixelFilter: colorize // see the colorize() function below }); // This function is applied to the pixelFilter property of the layer. // It takes the original value of each pixel and converts it to an RGB // representation to color the layer on a blue - red ramp. Blue pixels // represent low values and red pixels represent high values. View the sample // referenced above to see how this function works function colorize(pixelData) { // If there isn't pixelData, a pixelBlock, nor pixels, exit the function if (pixelData === null || pixelData.pixelBlock === null || pixelData.pixelBlock.pixels === null) { return; } // The pixelBlock stores the values of all pixels visible in the view var pixelBlock = pixelData.pixelBlock; // Get the min and max values of the data in the current view var minValue = pixelBlock.statistics[0].minValue; var maxValue = pixelBlock.statistics[0].maxValue; // The mask is an array that determines which pixels are visible to the client var mask = pixelBlock.mask; // The pixels visible in the view var pixels = pixelBlock.pixels; // The number of pixels in the pixelBlock var numPixels = pixelBlock.width * pixelBlock.height; // Calculate the factor by which to determine the red and blue // values in the colorized version of the layer var factor = 255.0 / (maxValue - minValue); // Get the pixels containing temperature values in the only band of the data var band1 = pixels[0]; // Create empty arrays for each of the RGB bands to set on the pixelBlock var rBand = []; var gBand = []; var bBand = []; // Loop through all the pixels in the view for (i = 0; i < numPixels; i++) { // Get the pixel value recorded at the pixel location var tempValue = band1[i]; // Calculate the red value based on the factor var red = (tempValue - minValue) * factor; // Sets a color between blue (lowest) and red (highest) in each band rBand[i] = red; gBand[i] = 0; bBand[i] = 255 - red; } // Set the new pixel values on the pixelBlock (now three bands) pixelData.pixelBlock.pixels = [rBand, gBand, bBand]; pixelData.pixelBlock.pixelType = "u8"; // u8 is used for color }
- pixelType String
Raster source pixel type.
Value Range of values that each cell can contain unknown Pixel type is unknown s8 -128 to 127 s16 -32768 to 32767 s32 -2147483648 to 2147483647 u8 0 to 255 u16 0 to 65535 u32 0 to 4294967295 f32 -3.402823466e+38 to 3.402823466e+38 f64 0 to 18446744073709551616 Possible Values:"unknown"|"s8"|"s16"|"s32"|"u8"|"u16"|"u32"|"f32"|"f64"
- popupEnabled Boolean
Indicates whether to display popups when features in the layer are clicked.
- Default Value:true
- See also:
- popupTemplate PopupTemplateautocast
The popup template for the layer. When set on the layer, the popupTemplate allows users to access attributes and display their values using text and/or charts in the view's popup when a pixel is clicked. See this sample for an example of how PopupTemplate interacts with an ImageryLayer.
A default popup template is automatically used if no
popupTemplatehas been defined when Popup.defaultPopupTemplateEnabled is set totrue.Example:// displays the temperature stored in the clicked pixel layer.popupTemplate: { title: "Sea Surface Temperature", content: "{Raster.ServicePixelValue}° Celsius" }
- portalItem PortalItem
The portal item from which the layer is loaded. If the portal item references a Feature Service or Scene Service, then you can specify a single layer to load with the layerId property.
Beginning with version 4.17, it is possible to load tables from feature service items hosted in ArcGIS Online and ArcGIS Enterprise. This only applies to feature layers, and will successfully load if FeatureLayer.isTable returns
true.Examples:// While this example uses FeatureLayer, this same pattern can be // used for other layers that may be loaded from portalItem ids. const lyr = new FeatureLayer({ portalItem: { // autocasts as new PortalItem() id: "caa9bd9da1f4487cb4989824053bb847" } // the first layer in the service is returned });// Set hostname when using an on-premise portal (default is ArcGIS Online) // esriConfig.portalUrl = "http://myHostName.esri.com/arcgis"; // While this example uses FeatureLayer, this same pattern can be // used for SceneLayers. const lyr = new FeatureLayer({ portalItem: { // autocasts as new PortalItem() id: "8d26f04f31f642b6828b7023b84c2188" }, // loads the third item in the given feature service layerId: 2 });// This snippet loads a table hosted in ArcGIS Online. const table = new FeatureLayer({ portalItem: { // autocasts as esri/portal/PortalItem id: "123f4410054b43d7a0bacc1533ceb8dc" } }); // Before adding the table to the map, it must first be loaded and confirm it is the right type. table.load().then(function() { if (table.isTable) { map.tables.add(table); } });
- rasterAttributeTableFieldPrefix String
Prefix used to define the fields from the raster attribute table. It's primarily used for popups
A complete list of fields that consists of raster catalog fields, item pixel value, service pixel value, service pixel value with various server defined function templates, and raster attribute table fields. This list is used for layer's popupTemplate.
Example:layer.when(function(){ // print out field names returned in layer.rasterFields layer.rasterFields.forEach(function(field){ console.log(field.name); }); });
- refreshInterval NumberSince: ArcGIS API for JavaScript 4.6
Refresh interval of the layer in minutes. Value of
0indicates no refresh.- Default Value:0
Example:// the layer will be refreshed every 6 seconds. layer.refreshInterval = 0.1;
- Since: ArcGIS API for JavaScript 4.11
The renderer assigned to the layer. The renderer defines how to visualize pixels in the tile imagery layer. Depending on the renderer type, the pixels may be stretched across the color ramp, classified, have different symbols based on values, or show shaded reliefs.
If both renderer and pixelFilter is applied to an ImageryLayer then pixelFilter will override the renderer.
- renderingRule RasterFunctionautocast
Specifies the rule for how the requested image should be rendered. When renderingRule applied, the server returns an updated service information that reflects a custom processing as defined by the rendering rule.
- See also:
Example:const stretchFunction = new RasterFunction({ functionName: "Stretch", functionArguments: { StretchType: 5, // (0 = None, 3 = StandardDeviation, 4 = Histogram Equalization, 5 = MinMax, 6 = PercentClip, 9 = Sigmoid) Min: 0, Max: 255, Raster: "$$" // $$(default) refers to the entire image service, $2 refers to the second image of the image service }, outputPixelType: "u8" }); const colorFunction = new RasterFunction({ functionName: "Colormap", functionArguments: { ColorrampName: "Temperature", // other examples: "Slope", "Surface", "Blue Bright".... Raster: stretchFunction // chaining multiple rasterfunctions } }); const imageryLayer = new ImageryLayer({ url: "https://sampleserver6.arcgisonline.com/arcgis/rest/services/ScientificData/SeaTemperature/ImageServer" }); imageryLayer.renderingRule = colorFunction; // Set rendering rule to the raster function
- serviceRasterInfo RasterInforeadonlySince: ArcGIS API for JavaScript 4.12
Source raster information of the image service. The layer must be loaded before serviceRasterInfo can be accessed.
- See also:
- sourceJSON ObjectSince: ArcGIS API for JavaScript 4.13
The image service's metadata JSON exposed by the ArcGIS REST API. While most commonly used properties are exposed on the ImageryLayer class directly, this property gives access to all information returned by the image service. This property is useful if working in an application built using an older version of the API which requires access to image service properties from a more recent version.
The spatial reference of the image service.
- timeExtent TimeExtentautocastSince: ArcGIS API for JavaScript 4.14
The layer's time extent. When the layer's useViewTime is
false, the layer instructs the view to show data from the layer based on this time extent. If theuseViewTimeistrue, and both layer and view time extents are set, then features that fall within the intersection of the view and layer time extents will be displayed. For example, if the layer's time extent is set to display features between 1970 and 1975 and the view has a time extent set to 1972-1980, the effective time on the feature layer will be 1972-1975.- Default Value:null
Examples:if (!layer.useViewTime) { if (layer.timeExtent) { console.log("Current timeExtent:", layer.timeExtent.start, " - ", layer.timeExtent.end} } else { console.log("The layer will display data within the view's timeExtent."); console.log("Current view.timeExtent:", view.timeExtent.start, " - ", view.timeExtent.end} } }// set the timeExtent on the layer and useViewTime false // In this case, the layer will honor its timeExtent and ignore // the view's timeExtent const layer = new ImageryLayer({ url: "https://sampleserver6.arcgisonline.com/arcgis/rest/services/ScientificData/SeaTemperature/ImageServer", timeExtent: { start: new Date(2014, 4, 18), end: new Date(2014, 4, 19) }, useViewTime: false });// timeExtent is set on the layer and the view // In this case, the layer will display features that fall // within the intersection of view and layer time extents // features within Jan 1, 1976 - Jan 1, 1981 will be displayed const view = new MapView({ timeExtent: { start: new Date(1976, 0, 1), end: new Date(2002, 0, 1) } }); const layer = new FeatureLayer({ url: myUrl, timeExtent: { start: new Date(1974, 0, 1), end: new Date(1981, 0, 1) } });
- Since: ArcGIS API for JavaScript 4.11
TimeInfo provides information such as date fields that store start and end time for each feature and the fullTimeExtent for the layer. The
timeInfoproperty, along with itsstartFieldandendFieldproperties, must be set at the time of layer initialization if it is being set for a CSVLayer, GeoJSONLayer or FeatureLayer initialized from client-side features. The fullTimeExtent fortimeInfois automatically calculated based on itsstartFieldandendFieldproperties. The timeInfo parameters cannot be changed after the layer is loaded.- Default Value:null
Example:// create geojson layer from usgs earthquakes geojson feed const geojsonLayer = new GeoJSONLayer({ url: "https://earthquake.usgs.gov/earthquakes/feed/v1.0/summary/all_month.geojson", copyright: "USGS Earthquakes", fields: [ { "name": "mag", "type": "double" }, { "name": "place", "type": "string" }, { "name": "time", "type": "date" }, // date field { "name": "depth", "type": "double" } ], // timeInfo can be used to do temporal queries // set the startField and endField. // timeExtent is automatically calculated from the // the start and end date fields timeInfo: { startField: "time" } });
- timeOffset TimeIntervalautocastSince: ArcGIS API for JavaScript 4.14
A temporary offset of the time data based on a certain TimeInterval. This allows users to overlay features from two or more time-aware layers with different time extents. For example, if a layer has data recorded for the year 1970, an offset value of 2 years would temporarily shift the data to 1972. You can then overlay this data with data recorded in 1972. A time offset can be used for display purposes only. The query and selection are not affected by the offset.
- Default Value:null
Example:// Offset a CSV Layer containing hurricanes from 2015 so that they appear in 2019 (+4 years). var layer = new CSVLayer({ url: `hurricanes-and-storms-2015.csv`, timeOffset: { value: 4, unit: "years" }, timeInfo: { startField: "ISO_time" }, renderer: { type: "simple", symbol: { type: "simple-marker", size: 6, color: "red", outline: { width: 0.5, color: "black" } } } });
- type Stringreadonly
For ImageryLayer the type is always "imagery".
- url String
The URL to the REST endpoint of the layer. The URL may either point to a resource on ArcGIS Enterprise or ArcGIS Online.
Example:// This url must point to an Image Service var layer = new ImageryLayer({ url: "http://sampleserver6.arcgisonline.com/arcgis/rest/services/CharlotteLAS/ImageServer" });
- useViewTime BooleanSince: ArcGIS API for JavaScript 4.14
Determines if the layer will update its temporal data based on the view's timeExtent. When
false, the layer will display its temporal data based on the layer's timeExtent, regardless of changes to the view. If both view and layer time extents are set while this property istrue, then the features that fall within the intersection of the view and layer time extents will be displayed. For example, if a layer's time extent is set to display features between 1970 and 1975 and the view has a time extent set to 1972-1980, the effective time on the feature layer will be 1972-1975.- Default Value:true
Example:if (featureLayer.useViewTime) { console.log("Displaying data between:", view.timeExtent.start, " - ", view.timeExtent.end); }
- version Numberreadonly
The version of ArcGIS Server in which the image service is published.
Example:// Prints the version number to the console, e.g. 10.2, 10.3, 10.41 console.log(layer.version);
Indicates if the layer is visible in the View. When
false, the layer may still be added to a Map instance that is referenced in a view, but its features will not be visible in the view.- Default Value:true
Example:// The layer is no longer visible in the view layer.visible = false;
Method Overview
| Name | Return Type | Summary | Class | |
|---|---|---|---|---|
Cancels a load() operation if it is already in progress. more details | more details | Layer | ||
| Promise<Object> | Computes histograms based on the provided ImageHistogramParameters. more details | more details | ImageryLayer | |
| Promise<Object> | Computes statistics and histograms for the provided ImageHistogramParameters. more details | more details | ImageryLayer | |
| Promise<LayerView> | Called by the views, such as MapView and SceneView, when the layer is added to the Map.layers collection and a layer view must be created for it. more details | more details | Layer | |
| PopupTemplate | Creates a default popup template for the layer, populated with all the fields of the layer. more details | more details | ImageryLayer | |
Destroys the layer and any associated resources (including its portalItem, if it is a property on the layer). more details | more details | Layer | ||
| Boolean | Emits an event on the instance. more details | more details | Layer | |
| Promise<Object> | Fetches custom attribution data for the layer when it becomes available. more details | more details | Layer | |
| Promise<Object> | Returns an image using the export REST operation that displays data from an ImageryLayer. more details | more details | ImageryLayer | |
| Promise<RasterInfo> | Generates raster info for the specified rendering rule. more details | more details | ImageryLayer | |
| Promise<Object> | Gets the image coordinate system information of a catalog item in an image service. more details | more details | ImageryLayer | |
| Promise<RasterInfo> | Get the raster info of a catalog item in an image service. more details | more details | ImageryLayer | |
| Boolean | Indicates whether there is an event listener on the instance that matches the provided event name. more details | more details | Layer | |
| Promise<ImageIdentifyResult> | Sends a request to the ArcGIS REST image service to identify content based on the specified ImageIdentifyParameters. more details | more details | ImageryLayer | |
| Boolean |
| more details | Layer | |
| Boolean |
| more details | Layer | |
| Boolean |
| more details | Layer | |
| Promise | Loads the resources referenced by this class. more details | more details | Layer | |
| Object | Registers an event handler on the instance. more details | more details | Layer | |
| Promise<FeatureSet> | Executes the query task defined in queryTask. more details | more details | ImageryLayer | |
Executes the pixelFilter function and redraws the layer. more details | more details | ImageryLayer | ||
Fetches all the data for the layer. more details | more details | ImageryLayer | ||
| Promise |
| more details | Layer |
Method Details
- Since: ArcGIS API for JavaScript 4.18
Computes histograms based on the provided ImageHistogramParameters. If a rendering rule and a mosaic rule are not specified, the current settings on the layer will be used. This operation is supported by an image service published with a mosaic dataset or a raster dataset at ArcGIS Server 10.4 and later. The result of this operation contains histograms computed for the given extent.
Parameters:parameters ImageHistogramParametersSpecifies parameters for computing histograms.
options ObjectoptionalAn object with the following properties.
Specification:signal AbortSignaloptionalSignal object that can be used to abort the asynchronous task. The returned promise will be rejected with an Error named
AbortErrorwhen an abort is signaled. See also AbortController for more information on how to construct a controller that can be used to deliver abort signals.Returns:Type Description Promise<Object> Resolves to an object containing histogram results. See the object specification table below for details. Property Type Description histograms[] RasterHistogram Result containing raster histograms. Example:// set the pixel size parameter to match the current // resolution of the view and spatial reference var pixelSize = { x:view.resolution, y:view.resolution, spatialReference: { wkid: view.spatialReference.wkid } } // set the histogram parameters to request // data for the current view extent and resolution var params = new ImageHistogramParameters({ geometry: view.extent, pixelSize: pixelSize }); // request for histograms for the specified parameters layer.computeHistograms(params).then(function(results){ // results are returned and process it as needed. console.log("histograms and stats", results); }) .catch(function(err){ console.log("err", err) });
- Since: ArcGIS API for JavaScript 4.18
Computes statistics and histograms for the provided ImageHistogramParameters. If a rendering rule and a mosaic rule are not specified, the current settings on the layer will be used. This operation is supported by an image service published with a mosaic dataset or a raster dataset at ArcGIS Server 10.4 and later. The result of this operation contains both statistics and histograms computed for the given extent.
Parameters:parameters ImageHistogramParametersSpecifies parameters for computing statistics and histograms.
options ObjectoptionalAn object with the following properties.
Specification:signal AbortSignaloptionalSignal object that can be used to abort the asynchronous task. The returned promise will be rejected with an Error named
AbortErrorwhen an abort is signaled. See also AbortController for more information on how to construct a controller that can be used to deliver abort signals.Returns:Type Description Promise<Object> Resolves to an object containing histogram and statistics results. See the object specification table below for details. Property Type Description histograms[] RasterHistogram Result containing raster histograms. bandStatistics[] RasterBandStatistics Raster band statistics. Example:// set the pixel size parameter to match the current // resolution of the view and spatial reference var pixelSize = { x:view.resolution, y:view.resolution, spatialReference: { wkid: view.spatialReference.wkid } } // set the histogram parameters to request // data for the current view extent and resolution var params = new ImageHistogramParameters({ geometry: view.extent, pixelSize: pixelSize }); // request for histograms and statistics for the specified parameters layer.computeStatisticsHistograms(params).then(function(results){ // results are returned and process it as needed. console.log("histograms and stats", results); }) .catch(function(err){ console.log("err", err) });
Called by the views, such as MapView and SceneView, when the layer is added to the Map.layers collection and a layer view must be created for it. This method is used internally and there is no use case for invoking it directly.
Parameters:view *The parent view.
options ObjectoptionalAn object specifying additional options. See the object specification table below for the required properties of this object.
Specification:signal AbortSignaloptionalA signal to abort the creation of the layerview.
Returns:Type Description Promise<LayerView> Resolves with a LayerView instance. - See also:
- createPopupTemplate(options){PopupTemplate}Since: ArcGIS API for JavaScript 4.11
Creates a default popup template for the layer, populated with all the fields of the layer.
Parameter:options CreatePopupTemplateOptionsoptionalOptions for creating the popup template.
Returns:Type Description PopupTemplate The popup template, or nullif the layer does not have any fields.
- destroy()inheritedSince: ArcGIS API for JavaScript 4.17
Destroys the layer and any associated resources (including its portalItem, if it is a property on the layer). The layer can no longer be used once it has been destroyed.
The destroyed layer will be removed from its parent object like Map, WebMap, WebScene, Basemap, Ground, or GroupLayer.
- Since: ArcGIS API for JavaScript 4.5
Emits an event on the instance. This method should only be used when creating subclasses of this class.
Parameters:type StringThe name of the event.
event ObjectoptionalThe event payload.
Returns:Type Description Boolean trueif a listener was notified
Fetches custom attribution data for the layer when it becomes available.
Returns:Type Description Promise<Object> Resolves to an object containing custom attribution data for the layer.
Returns an image using the export REST operation that displays data from an ImageryLayer.
Parameters:extent ExtentThe extent of the image to export.
width NumberThe width of the image in pixels.
height NumberThe height of the image in pixels.
options ObjectoptionalThe parameter options is an object with the following properties.
Specification:signal AbortSignaloptionalAn AbortSignal to abort the request. If canceled, the promise will be rejected with an error named
AbortError. See also AbortController.Returns:Type Description Promise<Object> Resolves to an object containing the parameters of the exported image including the PixelBlock. The pixelBlockcontains the value of each pixel in the image. Use this object to call the export REST operation.
- generateRasterInfo(renderingRule){Promise<RasterInfo>}Since: ArcGIS API for JavaScript 4.12
Generates raster info for the specified rendering rule.
Parameter:renderingRule RasterFunctionRendering rule for the requested raster info.
Returns:Type Description Promise<RasterInfo> When resolved, a RasterInfo containing info specific to the requested rendering rule is returned.
- Since: ArcGIS API for JavaScript 4.13
Gets the image coordinate system information of a catalog item in an image service. The returned object can be used to set the 2D MapView's spatialReference and extent so that the image can be displayed in its original coordinate system. The image service must have a catalog capability.
Parameters:rasterId NumberRaster catalog id.
abortOptions AbortSignaloptionalSignal object that can be used to abort the asynchronous task.
Returns:Type Description Promise<Object> When resolved, returns an object containing image coordinate system of the raster catalog item. Example:// get image coordinate system of the specified catalog item // for example Raster.OBJECTID = 1600 layer.getCatalogItemICSInfo(imageId).then(function(info) { // create a spatialReference object and set its // imageCoordinateSystem property var sr = { // autocasts to esri/geometry/SpatialReference imageCoordinateSystem: { id: imageId } }; // Calculate an extent for the mapview based on the image's extent // in its original coordinate system const width = document.getElementById("viewDiv").getBoundingClientRect().width; const height = document.getElementById("viewDiv").getBoundingClientRect().height; const newExt = info.icsExtent.clone(); const scaleFactor = 5; newExt.xmin = (newExt.xmin + newExt.xmax - width * scaleFactor) / 2; newExt.xmax = newExt.xmin + width * scaleFactor; newExt.ymin = (newExt.ymin + newExt.ymax - height * scaleFactor) / 2; newExt.ymax = newExt.ymin + height * scaleFactor; newExt.spatialReference = sr; // set the MapView's spatialReference to the image's coordinate system // and the extent to the extent calculated above view = new MapView({ container: "viewDiv", map: map, spatialReference: sr, extent: newExt }); });
- getCatalogItemRasterInfo(rasterId, abortOptions){Promise<RasterInfo>}Since: ArcGIS API for JavaScript 4.13
Get the raster info of a catalog item in an image service. Each raster catalog item represents a feature in the raster catalog. Each such feature has an associated raster. The image service must have a catalog capability.
Parameters:rasterId NumberRaster catalog id.
abortOptions AbortSignaloptionalSignal object that can be used to abort the asynchronous task.
Returns:Type Description Promise<RasterInfo> When resolved, a RasterInfo containing info specific to the catalog item is returned.
Indicates whether there is an event listener on the instance that matches the provided event name.
Parameter:type StringThe name of the event.
Returns:Type Description Boolean Returns true if the class supports the input event.
- identify(paramaters, options){Promise<ImageIdentifyResult>}Since: ArcGIS API for JavaScript 4.18
Sends a request to the ArcGIS REST image service to identify content based on the specified ImageIdentifyParameters. If a rendering rule and a mosaic rule are not specified, then the current layer settings will be used.
Parameters:paramaters ImageIdentifyParametersThe identify parameters used in the identify operation.
options ObjectoptionalAn object with the following properties.
Specification:signal AbortSignaloptionalSignal object that can be used to abort the asynchronous task. The returned promise will be rejected with an Error named
AbortErrorwhen an abort is signaled. See also AbortController for more information on how to construct a controller that can be used to deliver abort signals.Returns:Type Description Promise<ImageIdentifyResult> When resolved, a ImageIdentifyResult is returned.
isFulfilled()may be used to verify if creating an instance of the class is fulfilled (either resolved or rejected). If it is fulfilled,truewill be returned.Returns:Type Description Boolean Indicates whether creating an instance of the class has been fulfilled (either resolved or rejected).
isRejected()may be used to verify if creating an instance of the class is rejected. If it is rejected,truewill be returned.Returns:Type Description Boolean Indicates whether creating an instance of the class has been rejected.
isResolved()may be used to verify if creating an instance of the class is resolved. If it is resolved,truewill be returned.Returns:Type Description Boolean Indicates whether creating an instance of the class has been resolved.
Loads the resources referenced by this class. This method automatically executes for a View and all of the resources it references in Map if the view is constructed with a map instance.
This method must be called by the developer when accessing a resource that will not be loaded in a View.
The
load()method only triggers the loading of the resource the first time it is called. The subsequent calls return the same promise.It's possible to provide a
signalto stop being interested into aLoadableinstance load status. When the signal is aborted, the instance does not stop its loading process, only cancelLoad can abort it.Parameter:signal AbortSignaloptionalSignal object that can be used to abort the asynchronous task. The returned promise will be rejected with an Error named
AbortErrorwhen an abort is signaled. See also AbortController for more information on how to construct a controller that can be used to deliver abort signals.Returns:Type Description Promise Resolves when the resources have loaded.
Registers an event handler on the instance. Call this method to hook an event with a listener.
Parameters:A event type, or an array of event types, to listen for.
listener FunctionThe function to call when the event is fired.
Returns:Type Description Object Returns an event handler with a remove()method that can be called to stop listening for the event(s).Property Type Description remove Function When called, removes the listener from the event. Example:view.on("click", function(event){ // event is the event handle returned after the event fires. console.log(event.mapPoint); });
- queryRasters(query, options){Promise<FeatureSet>}
Executes the query task defined in queryTask.
Parameters:query QueryThe query parameters used in the query task.
options ObjectoptionalAn object with the following properties.
Specification:signal AbortSignaloptionalSignal object that can be used to abort the asynchronous task. The returned promise will be rejected with an Error named
AbortErrorwhen an abort is signaled. See also AbortController for more information on how to construct a controller that can be used to deliver abort signals.Returns:Type Description Promise<FeatureSet> When resolved, a FeatureSet containing an array of graphics is returned. - See also:
Example:var params = new Query({ // Define query parameters here }); layer.queryRasters(params).then(function(response){ // The response is a FeatureSet if results are found });
- redraw()
Executes the pixelFilter function and redraws the layer.
Example:// function defined in layer.pixelFilter is re-executed layer.redraw();
- refresh()Since: ArcGIS API for JavaScript 4.6
Fetches all the data for the layer.
- Since: ArcGIS API for JavaScript 4.6
when()may be leveraged once an instance of the class is created. This method takes two input parameters: acallbackfunction and anerrbackfunction. Thecallbackexecutes when the instance of the class loads. Theerrbackexecutes if the instance of the class fails to load.Parameters:callback FunctionoptionalThe function to call when the promise resolves.
errback FunctionoptionalThe function to execute when the promise fails.
Returns:Type Description Promise Returns a new promise for the result of callbackthat may be used to chain additional functions.Example:// Although this example uses MapView, any class instance that is a promise may use when() in the same way var view = new MapView(); view.when(function(){ // This function will execute once the promise is resolved }, function(error){ // This function will execute if the promise is rejected due to an error });
Type Definitions
- PixelData
An object that provides the user access to pixels and their values in the layer. See the object specifications table below for details about each property. This object is used as input in the pixelFilter() function for filtering and processing each pixel in the block.
- Properties:
- extent Extent
The extent of the
pixelBlock.pixelBlock PixelBlockAn object representing the pixels in the view. This provides the user access to each pixel on the client via the pixels property of this object.
- PixelFilterFunction(pixelData)
Function definition for the pixelFilter property. See the example snippet in the pixelFilter documentation for more details.
Parameter:pixelData PixelDataAn object that provides the user access to pixels in and their values in the layer.
- RasterBandStatistics ObjectSince: ArcGIS API for JavaScript 4.18
Raster statistics information returned that meets the specified ImageHistogramParameters from the computeStatisticsHistograms() method.
- RasterHistogram ObjectSince: ArcGIS API for JavaScript 4.18
Raster histogram information returned that meets the specified ImageHistogramParameters from the computeHistograms() or computeStatisticsHistograms() method.
Event Overview
| Name | Type | Summary | Class | |
|---|---|---|---|---|
{view: View,layerView: LayerView} | Fires after the layer's LayerView is created and rendered in a view. more details | more details | Layer | |
{view: View,error: Error} | Fires when an error emits during the creation of a LayerView after a layer has been added to the map. more details | more details | Layer | |
{view: View,layerView: LayerView} | Fires after the layer's LayerView is destroyed and no longer renders in a view. more details | more details | Layer |
Event Details
- layerview-createinherited
Fires after the layer's LayerView is created and rendered in a view.
- Properties:
- view View
The view in which the
layerViewwas created.layerView LayerViewThe LayerView rendered in the view representing the layer in
layer. - See also:
Example:// This function will fire each time a layer view is created for this // particular view. layer.on("layerview-create", function(event){ // The LayerView for the layer that emitted this event event.layerView; });
- layerview-create-errorinherited
Fires when an error emits during the creation of a LayerView after a layer has been added to the map.
- Properties:
- view View
The view that failed to create a layerview for the layer emitting this event.
error ErrorAn error object describing why the layer view failed to create.
- See also:
Example:// This function fires when an error occurs during the creation of the layer's layerview layer.on("layerview-create-error", function(event) { console.error("LayerView failed to create for layer with the id: ", layer.id, " in this view: ", event.view); });