Note: Support for 3D on mobile devices may vary, view the system requirements for more information.
This sample demonstrates how to query features represented by aggregate point clusters. Clustering is a method of reducing points in a FeatureLayer, CSVLayer, GeoJSONLayer, or OGCFeatureLayer by grouping them into clusters based on their spatial proximity to one another. Typically, clusters are proportionally sized based on the number of features within each cluster. See the Point clustering - basic configuration if you are unfamiliar with clustering.
Querying clustered features allows you to do the following:
- Query and display statistics describing the clustered features in the popup.
- Query the extent of the features and display it in the view.
- Query all the clustered features and add them to the popup to be browsed by the user.
To query clustered features, you must provide the ObjectID of the cluster graphic to the Query.aggregateIds property and pass the parameters to the desired query method on the clustered layer's layer view.
const query = layerView.createQuery();
query.aggregateIds = [ 1 ];
// returns the features represented by the cluster with an ObjectID of 1
const { features } = await layerView.queryFeatures(query);
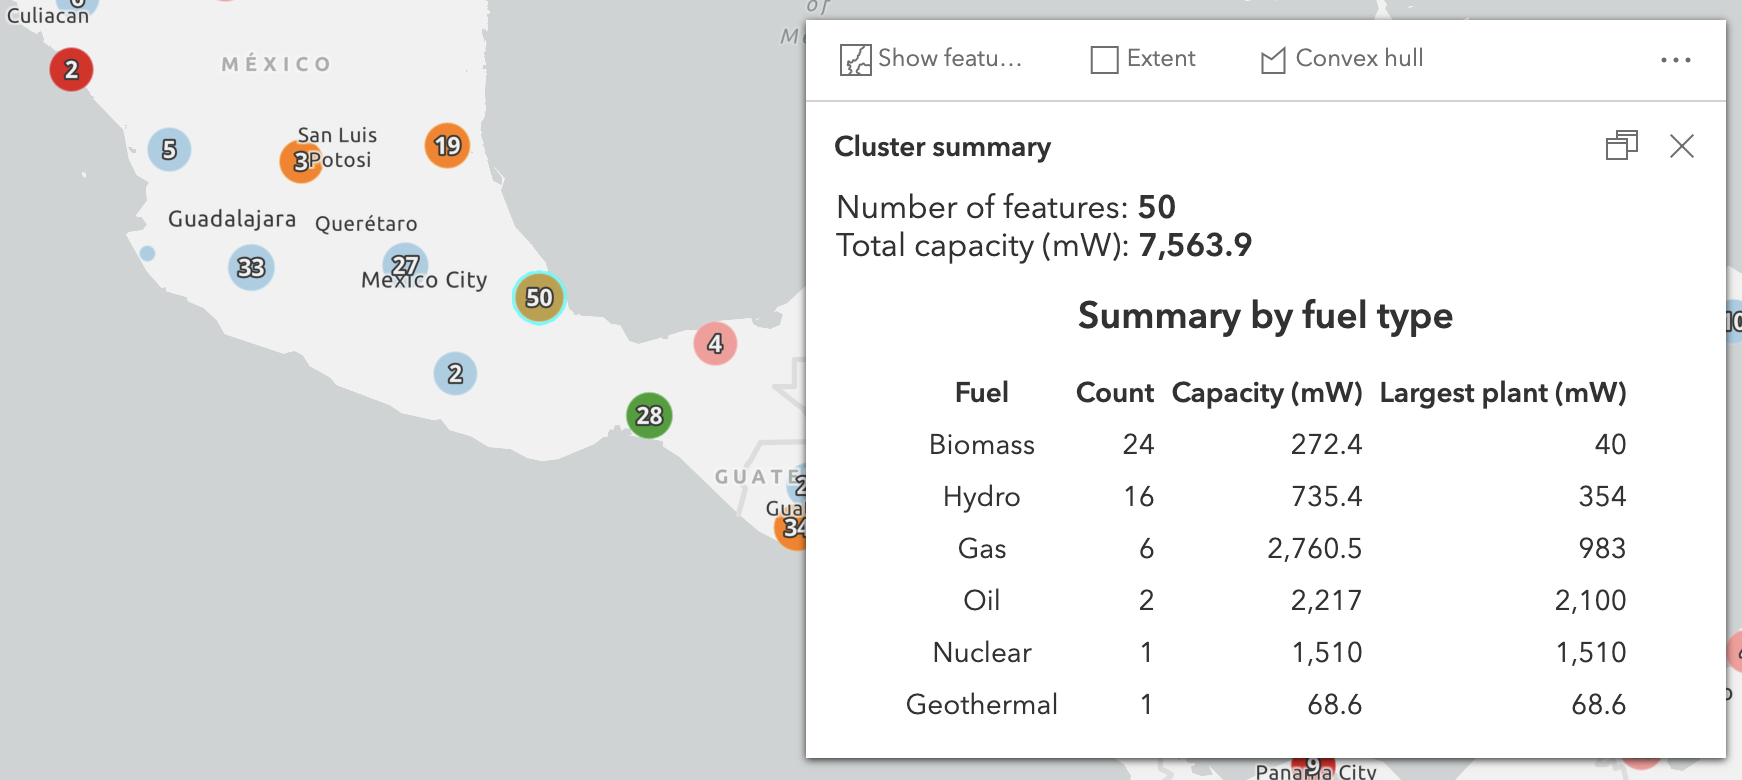
Query cluster statistics
To query statistics for the features included in a cluster, reference the ObjectID of the cluster graphic in Query.aggregateIds, then specify the query outStatistics. Since the clustered layer has a UniqueValueRenderer, we'll use groupByFieldsForStatistics to group the statistics by the field used to categorize the features in the renderer.
async function calculateStatistics(graphic){

  const query = layerView.createQuery();
  query.aggregateIds = [ graphic.getObjectId() ];
  query.groupByFieldsForStatistics = [ "fuel1" ];
  query.outFields = [ "capacity_mw", "fuel1" ];
  query.orderByFields = [ "num_features desc" ];
  query.outStatistics = [
    {
      onStatisticField: "capacity_mw",
      outStatisticFieldName: "capacity_total",
      statisticType: "sum"
    },
    {
      onStatisticField: "1",
      outStatisticFieldName: "num_features",
      statisticType: "count"
    },
    {
      onStatisticField: "capacity_mw",
      outStatisticFieldName: "capacity_max",
      statisticType: "max"
    }
  ];

  const { features } = await layerView.queryFeatures(query);
  const stats = features.map(feature => feature.attributes);

  // display stats in the popup
}
Query cluster extent
You may want to display the extent of the features to the user. To do this, reference the cluster graphic's ObjectID in Query.aggregateIds, and call the queryExtent method on the layer view.
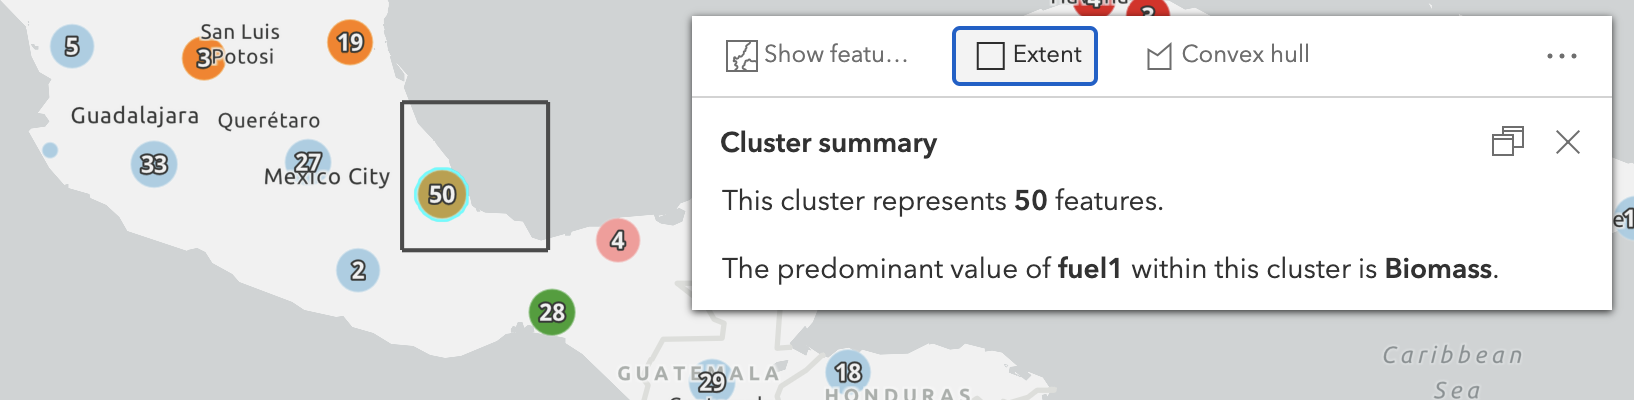
async function displayClusterExtent(graphic){
  const query = layerView.createQuery();
  query.aggregateIds = [ graphic.getObjectId() ];

  const { extent } = await layerView.queryExtent(query);
  const extentGraphic = {
    geometry: extent,
    symbol: {
      type: "simple-fill",
      outline: {
        width: 1.5,
        color: [ 75, 75, 75, 1 ]
      },
      style: "none",
      color: [ 0, 0, 0, 0.1 ]
    }
  };
  view.graphics.add(extentGraphic);
}
Calculate cluster convex hull
Perhaps it's better to show the convex hull of the clustered features rather than the extent since it more accurate represents the distribution of the points. The geometryEngine allows you to do that. Query for all the features in the cluster, get their geometries, then pass them to the convexHull method of geometryEngine.

async function displayConvexHull(graphic){
  const query = layerView.createQuery();
  query.aggregateIds = [ graphic.getObjectId() ];

  const { features } = await layerView.queryFeatures(query);
  const geometries = features.map( feature => feature.geometry );
  const [ convexHull ] = geometryEngine.convexHull(geometries, true);

  const convexHullGraphic = {
    geometry: convexHull,
    symbol: {
      type: "simple-fill",
      outline: {
        width: 1.5,
        color: [ 75, 75, 75, 1 ]
      },
      style: "none",
      color: [ 0, 0, 0, 0.1 ]
    }
  };
  view.graphics.add(convexHullGraphic);
}
Browse clustered features
You can also query all features in the cluster to create an experience for users to browse features within the cluster to view their popups.

async function browseFeatures(graphic){
  displayConvexHull(graphic);

  const query = layerView.createQuery();
  query.aggregateIds = [ graphic.getObjectId() ];

  const { features } = await layerView.queryFeatures(query);
  view.popup.features = [graphic].concat(features);

  selectedFeatureHandle = view.popup.watch("selectedFeature", async (feature) => {
    if(!feature || feature?.isAggregate){
      return;
    }
    const symbol = await symbolUtils.getDisplayedSymbol(feature);
    symbol.outline = {
      color: [50,50,50,0.75],
      width: 0.5
    };
    feature.symbol = symbol;

    if(selectedFeature && view.graphics.includes(selectedFeature)){
      view.graphics.remove(selectedFeature);
      selectedFeature = null;
    }
    view.graphics.add(feature);
    selectedFeature = feature;
  });
}
Related samples and resources
- Point clustering - basic configuration
- Point clustering with visual variables
- Point clustering - generate suggested configuration
- Point clustering - advanced configuration
- API reference - FeatureReductionCluster