Note: Support for 3D on mobile devices may vary, view the system requirements for more information.
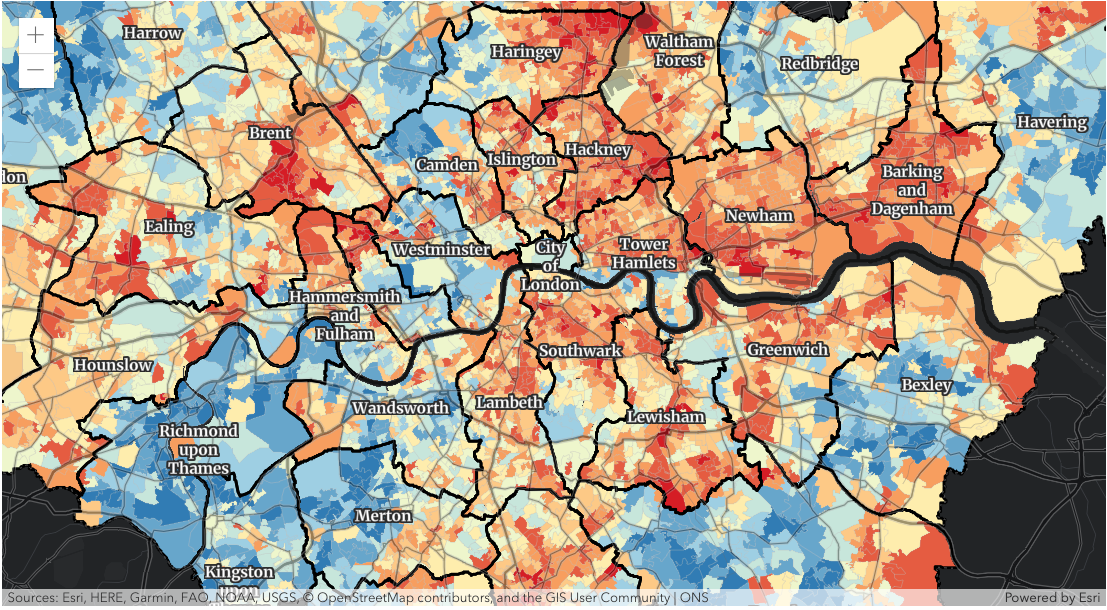
This sample shows how FeatureEffect can be used to draw attention features of interest. In this case, the map highlights areas in Greater London that intersect the boundaries of London boroughs. The map (inspired by this tweet) shows the overall index of multiple deprivation in 2019 experienced by people living in the Greater London area. This index is calculated for every Lower Layer Super Output Area (LSOA). The layer is symbolized to show an IMD decile, where 1 is the most deprived 10% of the LSOA.
How it works
When the layer view is loaded for the IMD deprivation layer, we set the following effects on the layer view. We apply a drop-shadow feature effect to the features that intersect the borough boundaries, while applying blur and brightness effects to the features that are excluded from the filter criteria. The resulting map will make it easier to spot if the residents are more likely to experience deprivation if they live on a borough boundary.
webmap.when(() => {
  const imdLayer = webmap.layers.items[0];
  view.whenLayerView(imdLayer).then(function (layerView){
    const featureFilter = {
      where: "BoroughEdge='true'"
    };
    layerView.effect = {
      filter: featureFilter,
      includedEffect: "drop-shadow(3px, 3px, 3px, black)",
      excludedEffect: "blur(1px) brightness(65%)"
    }
  });
});
The map would look like the following if the feature effect was not applied to the layer view.