Sketch widget
Note: Support for 3D on mobile devices may vary, view the system requirements for more information.
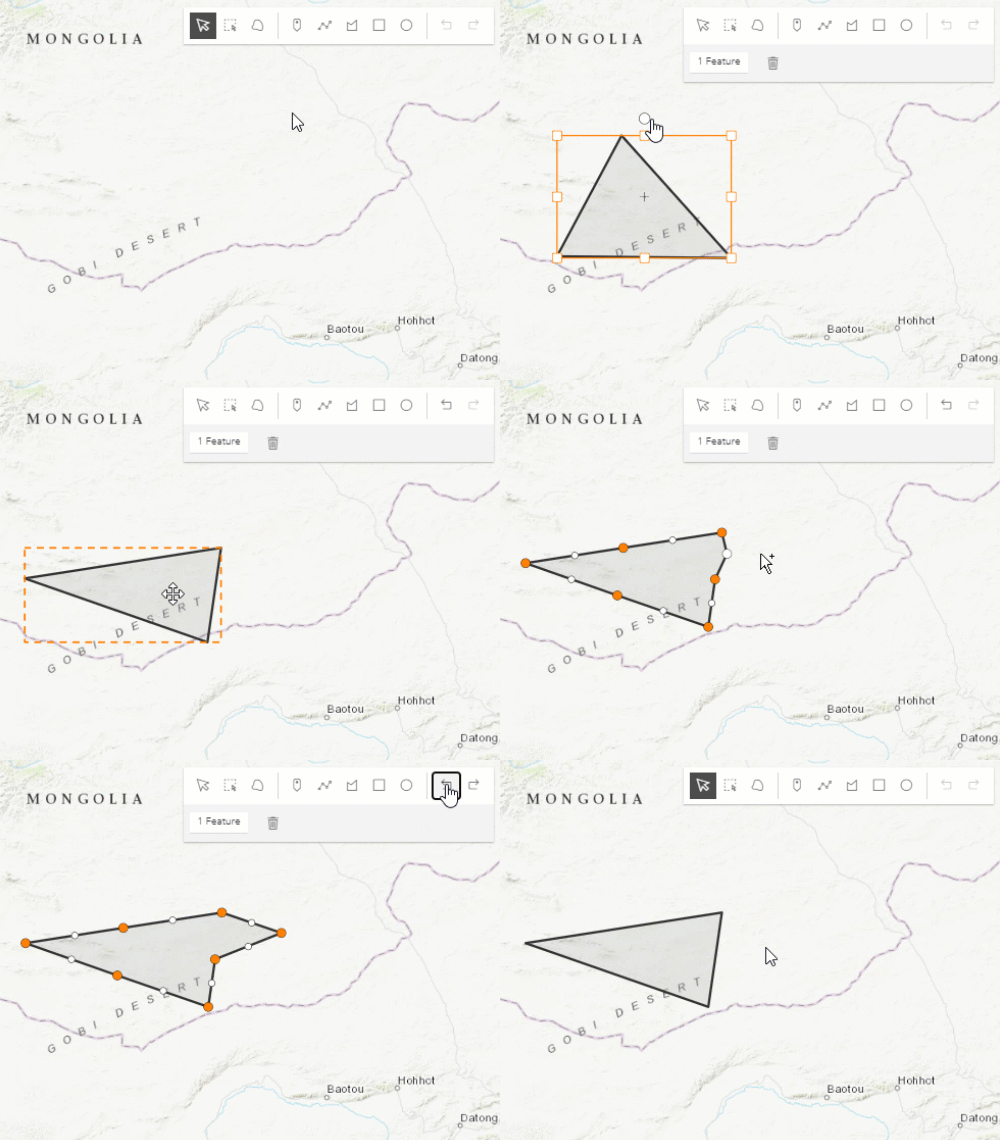
This sample demonstrates how to create new graphics or update existing graphics using Sketch widget in a 2D MapView. The same pattern is used for adding the widget to a SceneView. Sketch widget wires up all the relevant events for creating new graphics or updating existing graphics. This saves the effort of writings lots of code for creating and updating graphics.
To use the Sketch widget, create a new instance of the widget, and set its view and layer properties.
// create a new sketch widget
const sketch = new Sketch({
  view,
  layer: graphicsLayer
});
Once the application loads, you can start creating graphics with point, polyline, polygon, extent and circle geometries using relevant create tool. Once the graphics are created you can click on the graphic and start updating the graphic by rotating, scaling, moving or reshaping. You can also undo and redo your create and update operations while creating or updating the graphics.
